
The electrical response of plants to different environmental stimuli like soil water content and dark-light cycles can be measured and quantitatively related to the intensity of the triggering sources. A restricted soil water flow due to soil dryness can trigger water stress in plants and water stressed and unstressed in dark and light manifest different electrical responses. Important physiological information of plant can be obtained through processing and analysis of the signal. Real time plant electrical response measurements during day-night cycles, day/light conditions and at different conditions of soil water availability can be used as tools to assess early plant stress conditions. In this work, electrical potential differences are monitored continuously using Ag/AgCl micro-electrodes inserted at two positions of the spinach plant i.e. the leaf area and the stem-stalk interface. This research relates to the response of spinach plant electric signal to the soil water availability, light/dark conditions and circadian rhythm. The standard deviation of the spinach plant under light condition was 31.09, under dark condition 36.97, under wet condition 29.48 and under dry condition 37.68. The peak values of the spinach plant in micro-voltage for light, dark, wet and dry conditions were 104.7, 120.6, 44.3 and 90.7 respectively as shown in table under the Results section. The amplitude of the signal in the transition from day to light, of the plant under water stress and day/light cycles can used to reflect the status of the plant. The system was able to measure and analyze changes in electrical signals in plants in response to environmental changes.
| Published in | American Journal of Science, Engineering and Technology (Volume 11, Issue 4) |
| DOI | 10.11648/j.ajset.20261104.40 |
| Page(s) | 504-518 |
| Creative Commons |
This is an Open Access article, distributed under the terms of the Creative Commons Attribution 4.0 International License (http://creativecommons.org/licenses/by/4.0/), which permits unrestricted use, distribution and reproduction in any medium or format, provided the original work is properly cited. |
| Copyright |
Copyright © The Author(s), 2026. Published by Science Publishing Group |
Electric Signal, Circadian Rhythm, Abiotic Changes, Day-Night Cycles, Water Availability, Spinach Plant
Minimum (mV) | Maximum (mV) | Mean (mV) | Peak (mV) | Std (mV) | Mean square (mV) | ||
|---|---|---|---|---|---|---|---|
1 | Light | 22.483144 | 127.167 | 77.3429 | 104.683856 | 31.08875 | 8.798481 |
2 | Dark | 53.808353 | 174.385275 | 118.9683 | 120.576922 | 36.97064 | 10.90726 |
3 | Wet | 126.02537 | 170.300264 | 162.95 | 44.274894 | 29.47704 | 12.76519 |
4 | Dry | 163.203199 | 253.972769 | 200.5082 | 90.740779 | 37.67583 | 14.1601 |
Ag | Silver |
AgCl | Silver Chloride |
Ag/AgCl | Silver/Silver Chloride |
BNC | Bayonet Neill–Concelman Connector |
Cl⁻ | Chloride Ion |
EP | Electrical Potential |
ES | Electrical Signal |
H⁺ | Hydrogen Ion (Proton) |
HCl | Hydrogen Chloride |
KCl | Potassium Chloride |
Op-amp | Operational Amplifier |
PCB | Printed Circuit Board |
| [1] |
PhySense (2020). Example plant recording in Faraday Cage.
https://www.physense.eu/example-plant-recording-in-faraday-cage/ Accessed on 27th November 2020. |
| [2] | Bulychev, A. A., & Kamzolkina, N. A. (2006). Differential effects of plasma membrane electric excitation on H⁺ fluxes and photosynthesis in characean cells. Bioelectrochemistry, 69(2), 209–215. |
| [3] | Ben-Gal, A., Kool, D., Agam, N., van Halsema, G. E., Yermiyahu, U., Yafe, A., ... & Dag, A. (2010). Whole-tree water balance and indicators for short-term drought stress in non-bearing ‘Barnea’olives. Agricultural Water Management, 98(1), 124-133. |
| [4] | Circadian variations in biologically closed electrochemical circuits in Aloe vera and Mimosa pudica. Bioelectrochemistry 81: 39-45. |
| [5] | Datta, P. & Palit, P. (2004). Relationship between environmental factors and diurnal Variation of bioelectric potentials of an intact jute plant. Current Science 87: 680. |
| [6] | Dodd, A. N., Salathia, N., Hall, A., Kévei, E., Tóth, R., Nagy, F., Hibberd, J. M., Millar, A. J., & Webb, A. A. R. (2005). Plant circadian clocks increase photosynthesis, growth, survival, and competitive advantage. Science, 309, 630–633. |
| [7] | Fernández, J. E., Rodriguez-Dominguez, C. M., Perez-Martin, A., Zimmermann, U., Rüger, S., Martín-Palomo, M. J., et al. (2011). Online-monitoring of tree water stress in a hedgerow olive orchard using the leaf patch clamp pressure probe. Agricultural Water Management, 100(1), 25–35. |
| [8] | Fromm, J., & Fei, H. (1998). Electrical signaling and gas exchange in maize plants of drying soil. Plant Science, 132(2), 203–213. |
| [9] | Fromm, J., & Eschrich, W. (1993). Electric signals released from roots of willow (Salix viminalis L.) change transpiration and photosynthesis. Journal of Plant Physiology, 141(6), 673–680. |
| [10] | Gil, P. M., Gurovich, L., Schaffer, B., Alcayaga, J., Rey, S., & Iturriaga, R. (2008). Root to leaf electrical signaling in avocado in response to light and soil water content. Journal of Plant Physiology, 165(10), 1070–1078. |
| [11] | Goodspeed, D., Chehab, E. W., Covington, M. F., & Braam, J. (2013). Circadian control of jasmonates and salicylates: The clock role in plant defense. Plant Signaling & Behavior, 8(2), e23123. |
| [12] | Greenwood, M., & Locke, J. C. (2020). The circadian clock coordinates plant development through specificity at the tissue and cellular level. Current Opinion in Plant Biology, 53, 65–72. |
| [13] | Gurovich, L., & Hermosilla, P. (2009). Electric signaling in fruit trees in response to water applications and light-darkness conditions. Journal of Plant Physiology, 166(3), 290–300. |
| [14] | Hao, Z., Li, W., & Hao, X. (2021). Variations of electric potential in the xylem of tree trunks associated with water content rhythms. Journal of Experimental Botany, 72(4), 1321–1335. |
| [15] | Ives, J. R., & Phelan, S. E. (2010). U.S. Patent No. 7,643,861. Washington, DC: U.S. Patent and Trademark Officr. |
| [16] | Lautner, S., Grams, T. E. E., Matyssek, R., & Fromm, J. (2005). Characteristics of electrical signals in poplar and responses in photosynthesis. Plant Physiology, 138(4), 2200–2209. |
| [17] | Lito, M. G., & Camões, M. F. (2009). Meeting the requirements of the silver/silver chloride reference electrode. Journal of Solution Chemistry, 38(11), 1471–1482. |
| [18] | Lu, H., McClung, C. R., & Zhang, C. (2017). Tick tock: Circadian regulation of plant innate immunity. Annual Review of Phytopathology, 55, 287–311. |
| [19] | Miah, M. A., Nakagawa, Y., Tanimoto, R., Shinjo, R., Kondo, M., & Suzuki, H. (2019). Mass-producible disposable needle-type ion-selective electrodes for plant research. RSC Advances, 9(52), 30309–30316. |
| [20] | Mishra, N., Mallick, B., & Sopory, S. (2001). Electrical signal from root to shoot in Sorghum bicolor: Induction of leaf opening and evidence for fast extracellular propagation. Plant Science, 160(2), 237–245. |
| [21] | Moore, K. B., Kimball, T., & Steadman, B. (1990). Silver-silver chloride plunge electrode needles and chloriding monitor (bioelectric signal recording application). IEEE Transactions on Biomedical Engineering, 37(5), 532–535. |
| [22] | Oyarce P., Gurovich L. (2010). Electrical signals in avocado trees. Responses to light and water availability conditions. Plant Signal & Behav; 5: 34-41 |
| [23] | Oyarce, P., & Gurovich, L. (2011). Evidence for the transmission of information through electric potentials in injured avocado trees. Journal of Plant Physiology, 168(2), 103–108. |
| [24] | Ríos-Rojas, L., Morales-Moraga, D., Alcalde, J. A., & Gurovich, L. A. (2015). Use of plant woody species electrical potential for irrigation scheduling. Plant Signaling & Behavior, 10(2), e976487. |
| [25] | Sanchez, A., Shin, J., & Davis, S. J. (2011). Abiotic stress and the plant circadian clock. Plant Signaling & Behavior, 6(2), 223-231. |
| [26] | Spoel, S. H., & van Ooijen, G. (2014). Circadian redox signaling in plant immunity and abiotic stress. Antioxidants & Redox Signaling, 20(18), 3024–3039. |
| [27] | Volkov, A. G. (2000). Green plants: Electrochemical interfaces. J Electroanalitical Chemistry. 483: 150-156. |
| [28] | Volkov, A. G. (2018). Memristors and electrical memory in plants. In Memory and Learning in Plants (pp. 139-161). Springer, Cham. |
| [29] | Volkov, A. G., Adesina, T., Markin, V. S., & Jovanov, E. (2008). Kinetics and mechanism of Dionaea muscipula trap closing. Plant Physiology, 146(2), 694–702. |
| [30] | Volkov, A. G.; Baker, K.; Foster, J. C.; Clemmons, J.; Jovanov, E, & Markin, V. S. (2011). |
| [31] | Volkov, A. G.; Dunkley, T. C.; Morgan, S. A.; Ruff, D.; Boyce, Y. L. & Labady, A. J. (2004). Bioelectrochemical signaling in green plants induced by photosensory systems. Bioelectrochemistry 63: 91-94. |
| [32] | Whitmarsh J. (2004). Photosynthetic energy transduction. In: Raghavendra AS, editor. Photosynthesis: a comprehensive treatise. Cambridge: Cambridge University Press. |
| [33] | Yan, X., Wang, Z., Huang, L., Wang, C., Hou, R., Xu, Z., & Qiao, X. (2009). Research progress on electrical signals in higher plants. Progress in Natural Science, 19(5), 531–541. |
| [34] | Zhao, B., Liu, Q., Wang, B., & Yuan, F. (2021). Roles of phytohormones and their signaling pathways in leaf development and stress responses. Journal of Agricultural and Food Chemistry, 69(12), 3566-3584. |
APA Style
Wairimu, N. R., Kuria, K. P. (2026). Electrical Potential Responses to Dry/Wet, Light/Dark and Circadian Rhythm Conditions. American Journal of Science, Engineering and Technology, 11(4), 504-518. https://doi.org/10.11648/j.ajset.20261104.40
ACS Style
Wairimu, N. R.; Kuria, K. P. Electrical Potential Responses to Dry/Wet, Light/Dark and Circadian Rhythm Conditions. Am. J. Sci. Eng. Technol. 2026, 11(4), 504-518. doi: 10.11648/j.ajset.20261104.40
@article{10.11648/j.ajset.20261104.40,
  author = {Ndung’u Ruth Wairimu and Kamweru Paul Kuria},
  title = {Electrical Potential Responses to Dry/Wet, Light/Dark and Circadian Rhythm Conditions},
  journal = {American Journal of Science, Engineering and Technology},
  volume = {11},
  number = {4},
  pages = {504-518},
  doi = {10.11648/j.ajset.20261104.40},
  url = {https://doi.org/10.11648/j.ajset.20261104.40},
  eprint = {https://article.sciencepublishinggroup.com/pdf/10.11648.j.ajset.20261104.40},
  abstract = {The electrical response of plants to different environmental stimuli like soil water content and dark-light cycles can be measured and quantitatively related to the intensity of the triggering sources. A restricted soil water flow due to soil dryness can trigger water stress in plants and water stressed and unstressed in dark and light manifest different electrical responses. Important physiological information of plant can be obtained through processing and analysis of the signal. Real time plant electrical response measurements during day-night cycles, day/light conditions and at different conditions of soil water availability can be used as tools to assess early plant stress conditions. In this work, electrical potential differences are monitored continuously using Ag/AgCl micro-electrodes inserted at two positions of the spinach plant i.e. the leaf area and the stem-stalk interface. This research relates to the response of spinach plant electric signal to the soil water availability, light/dark conditions and circadian rhythm. The standard deviation of the spinach plant under light condition was 31.09, under dark condition 36.97, under wet condition 29.48 and under dry condition 37.68. The peak values of the spinach plant in micro-voltage for light, dark, wet and dry conditions were 104.7, 120.6, 44.3 and 90.7 respectively as shown in table under the Results section. The amplitude of the signal in the transition from day to light, of the plant under water stress and day/light cycles can used to reflect the status of the plant. The system was able to measure and analyze changes in electrical signals in plants in response to environmental changes.},
 year = {2026}
}
TY  - JOUR
T1  - Electrical Potential Responses to Dry/Wet, Light/Dark and Circadian Rhythm Conditions
AU  - Ndung’u Ruth Wairimu
AU  - Kamweru Paul Kuria
Y1  - 2026/11/09
PY  - 2026
N1  - https://doi.org/10.11648/j.ajset.20261104.40
DO  - 10.11648/j.ajset.20261104.40
T2  - American Journal of Science, Engineering and Technology
JF  - American Journal of Science, Engineering and Technology
JO  - American Journal of Science, Engineering and Technology
SP  - 504
EP  - 518
PB  - Science Publishing Group
SN  - 2578-8353
UR  - https://doi.org/10.11648/j.ajset.20261104.40
AB  - The electrical response of plants to different environmental stimuli like soil water content and dark-light cycles can be measured and quantitatively related to the intensity of the triggering sources. A restricted soil water flow due to soil dryness can trigger water stress in plants and water stressed and unstressed in dark and light manifest different electrical responses. Important physiological information of plant can be obtained through processing and analysis of the signal. Real time plant electrical response measurements during day-night cycles, day/light conditions and at different conditions of soil water availability can be used as tools to assess early plant stress conditions. In this work, electrical potential differences are monitored continuously using Ag/AgCl micro-electrodes inserted at two positions of the spinach plant i.e. the leaf area and the stem-stalk interface. This research relates to the response of spinach plant electric signal to the soil water availability, light/dark conditions and circadian rhythm. The standard deviation of the spinach plant under light condition was 31.09, under dark condition 36.97, under wet condition 29.48 and under dry condition 37.68. The peak values of the spinach plant in micro-voltage for light, dark, wet and dry conditions were 104.7, 120.6, 44.3 and 90.7 respectively as shown in table under the Results section. The amplitude of the signal in the transition from day to light, of the plant under water stress and day/light cycles can used to reflect the status of the plant. The system was able to measure and analyze changes in electrical signals in plants in response to environmental changes.
VL  - 11
IS  - 4
ER  -
Department of Basic Sciences, Tharaka University, Mariamanti, Kenya
Department of Physical Sciences, Chuka University, Chuka, Kenya
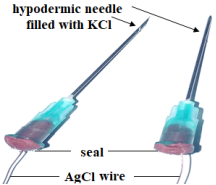
Figure 1. Locally fabricated electrodes.
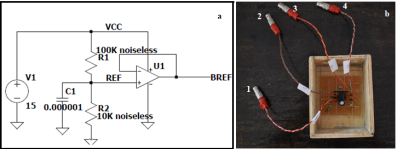
Figure 2. Fabricated voltage amplifier (a) its circuit and (b) designed and fabricated as a housed kit.
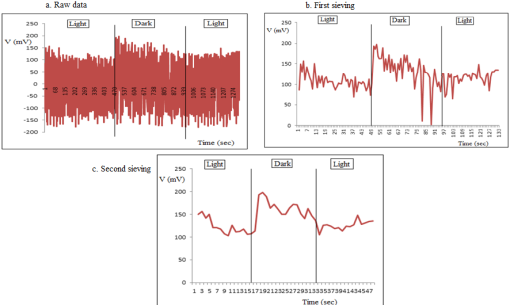
Figure 3. Effect of light/dark conditions on spinach outside the faraday cage (a) the raw data from the measurement kit with a digital lock-in using Ag/AgCl electrodes. (b) The data that results from first sieving using the excel Index match formula (=INDEX(B: B, MATCH(E2, D: D, 0)) to get maximum values of the EP and (c) The data after second sieving using excel formula (=INDEX(F: F, MATCH(I2, H: H, 0)).
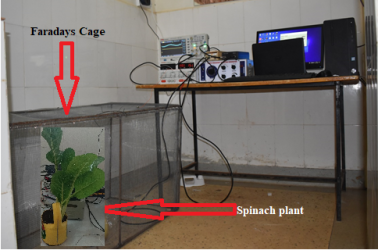
Figure 4. Electrical potential measurement set up, with the spinach plant inside a faraday cage.
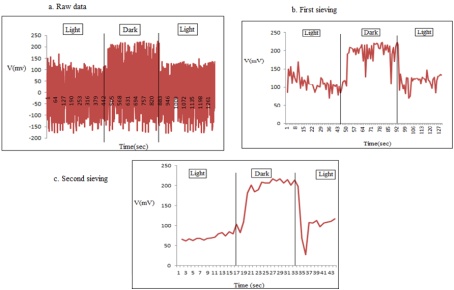
Figure 5. Effect of light/dark conditions on spinach inside a faraday cage. (a) Raw data, (b) after first sieving and (c) after second sieving.
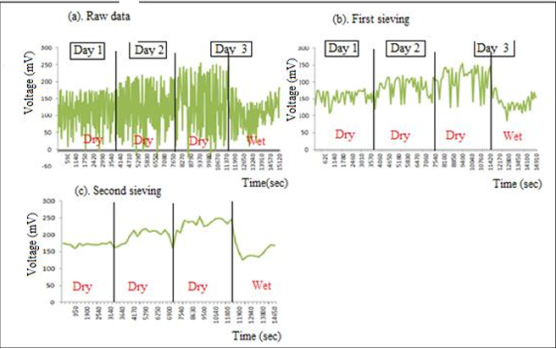
Figure 6. Effect of irrigation on EP behaviour of spinach plant.
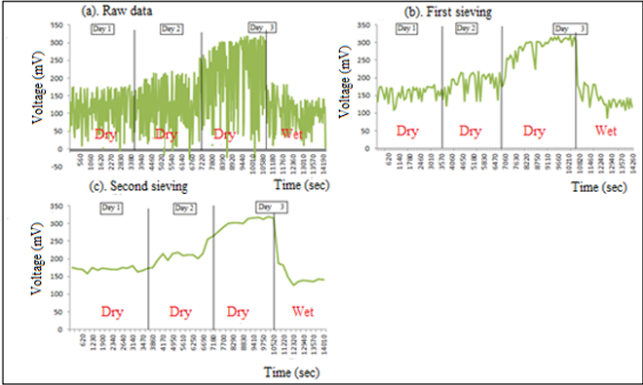
Figure 7. Effect of irrigation inside the Faraday Cage.
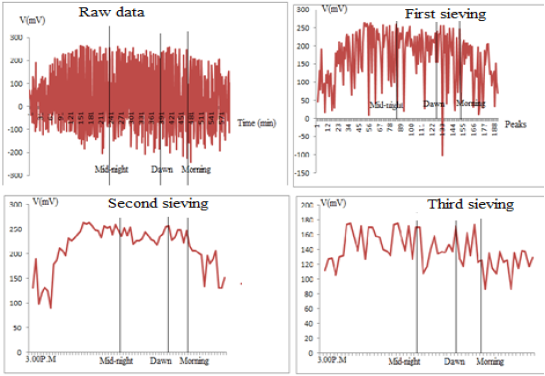
Figure 8. Electrical potential responses to the circadian cycle for spinach plant.
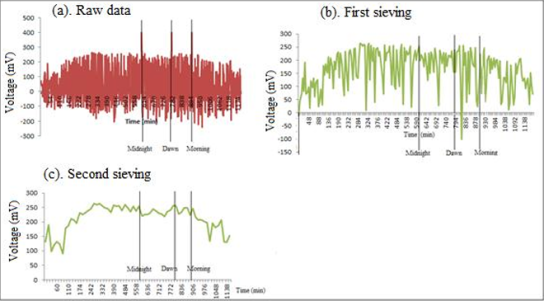
Figure 9. Electrical potential responses to the circadian cycle inside a Faraday Cage.
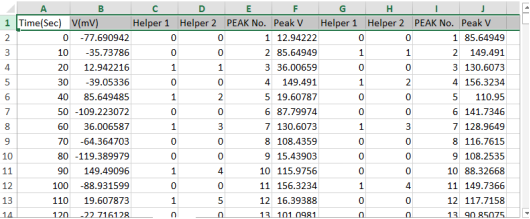
Figure 10. Excel snapshot of the tabulations of the EP from Spinach plant in column B, for the time in seconds in column A. Column C and D shows helper values (help to identify peak values) computed with the formula, =N(AND(B2>B3, B2>=B1)) and =SUM (C$2:C2, D1)*C2 respectively. Column E shows the peak number and column F shows the first sieved peak values of the EP in mV. Using replica formula, column G, H and I help to sieve for the second time, the peak values in mV shown in Column J. Respective graphs were plotted using relevant column values.
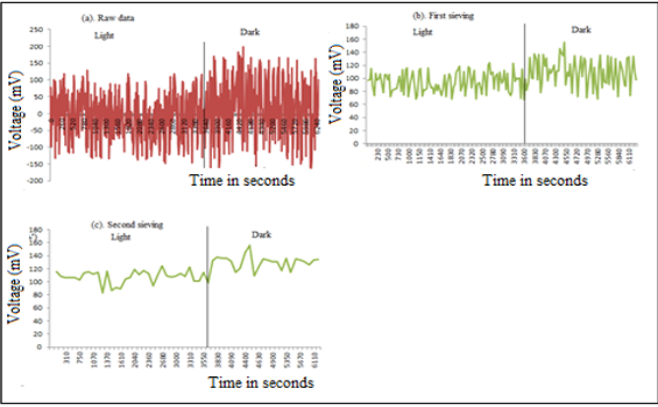
Figure 11. Effect of light / dark on EP behaviour of spinach plant outside the faraday cage
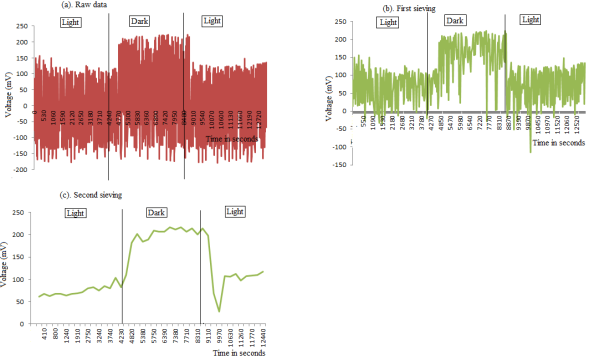
Figure 12. Effect of light / dark on EP behaviour of spinach plant outside the faraday cage.
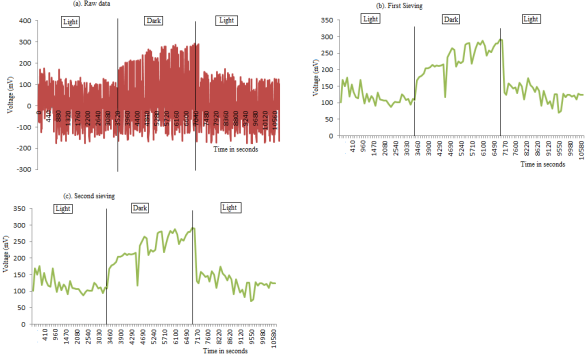
Figure 13. Effect of light / dark on EP behaviour of spinach plant inside the faraday cage.
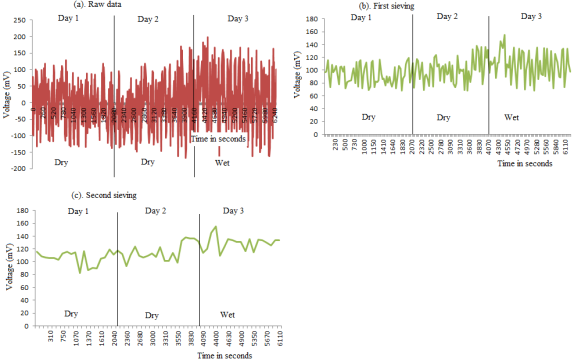
Figure 14. Effect of irrigation on EP behaviour of spinach plant outside the faraday cage.
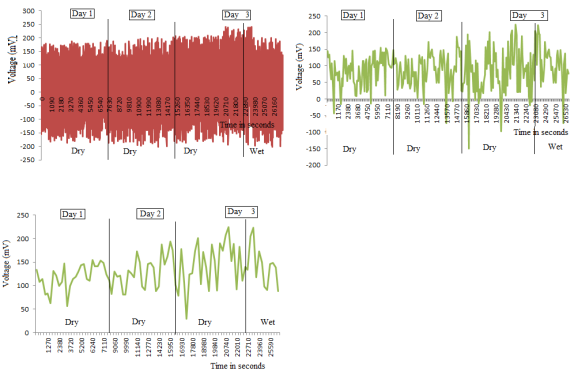
Figure 15. Effect of irrigation on EP behaviour of spinach plant outside the faraday cage.
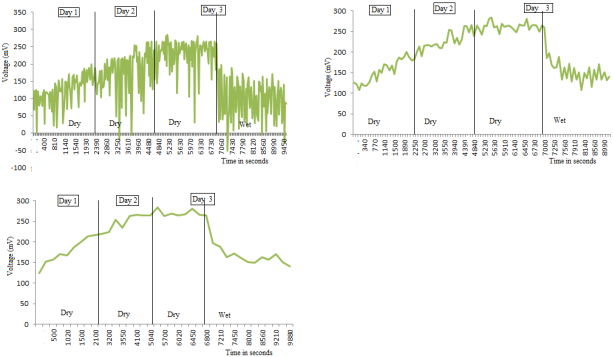
Figure 16. Effect of irrigation on EP behaviour of spinach plant inside the faraday cage.
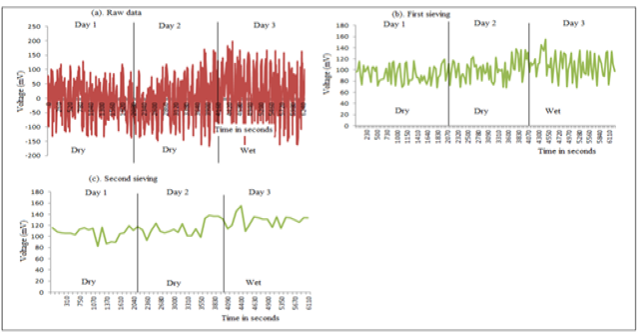
Figure 17. Electrical potential response to the circadian rhythm outside the faraday cage.
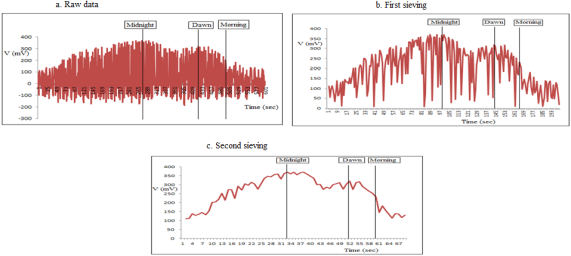
Figure 18. Electrical potential response to the circadian rhythm outside the faraday.
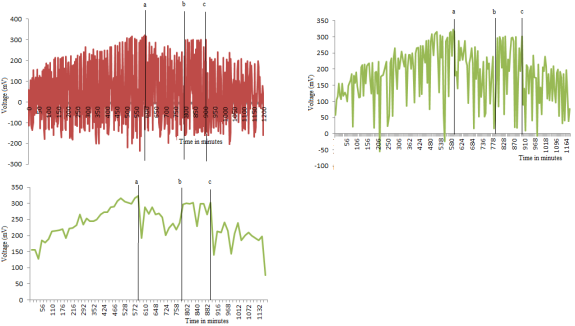
Figure 19. Electrical potential response to the circadian rhythm inside the faraday cage.

Information



 Share This Article
 Twitter
 Linked In
 Facebook

 Copy
 Download